

Type “AI football predictions” into any search bar and you’ll get flooded with sites promising sure things, guaranteed wins, and secret algorithms nobody else has. Strip away the marketing and what’s actually underneath is a lot more useful, and a lot less magical: statistics, probability, and models that get updated as new information comes in. This article walks through how these systems actually work, what data feeds them, and – just as importantly – where they fall short.
What AI Football Predictions Are
Before getting into the mechanics, it helps to be clear about what these tools actually are and aren’t, since the term gets used loosely.
Simple Definition
An AI football prediction is a probability estimate for a match outcome, generated by a model trained on historical data rather than a single person’s opinion. Instead of “I think City wins,” it’s closer to “the model gives City a 58% chance to win, a 24% chance to draw, and an 18% chance to lose” – a number built from patterns in thousands of past matches, not a gut feeling.
Why People Use Them
The appeal is consistency. A model doesn’t get tired, doesn’t favor a team it grew up supporting, and doesn’t chase losses by picking bigger favorites the next week. People use these predictions to sanity-check their own view of a match, to compare against bookmaker odds, or simply to get a faster read on a game they haven’t had time to research themselves.
How They Differ From Tipster Picks
A tipster gives you a pick and, often, a narrative to go with it – “they’ve got momentum,” “this feels like their game.” A model gives you a probability and the inputs behind it, and that probability doesn’t change based on how the last three tips performed. The tradeoff is that a model won’t catch a locker-room story or a manager’s private comments the way a well-connected tipster occasionally might – it only knows what’s in the data.
How the Prediction Engine Works
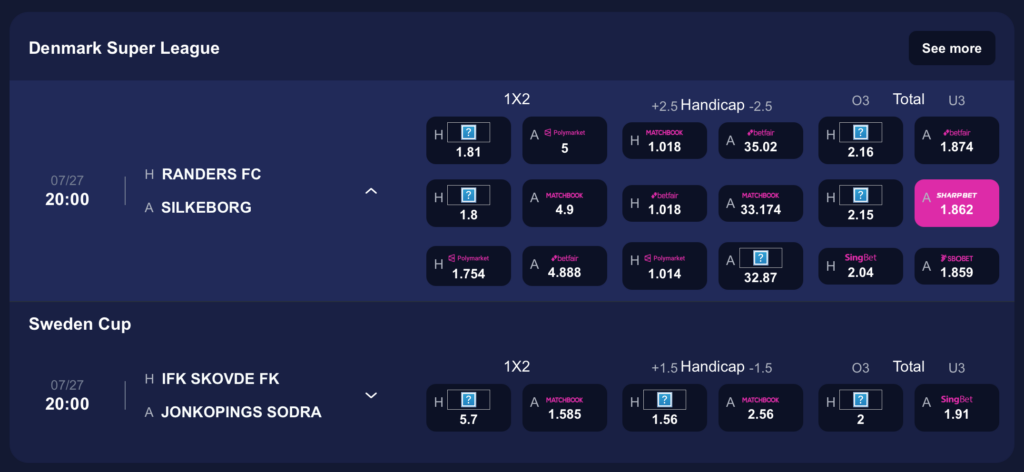
Underneath the probability number is a fairly standard pipeline: collect data, quantify team strength, model goals, and refresh everything as kickoff approaches.
Historical Match Data
Everything starts with results – who played whom, the score, the competition, and the date. On its own this is just a record, but fed into a model across enough matches, it starts to reveal patterns: which teams consistently outperform their league position, which struggle away from home, which tend to concede late.
Team Strength and Form
Raw results get converted into a strength rating – something like an Elo score, where a team’s rating rises after beating a strong opponent and falls after losing to a weak one. Recent matches are usually weighted more heavily than older ones, which is why “form over the last 5 to 10 games” matters more to a model than a result from 14 months ago.
Goal Models and Probabilities
Most football prediction engines are built around a goal-expectation model – estimating how many goals each team is likely to score based on their attack, the opponent’s defense, and home advantage, then converting those expected-goal figures into probabilities for a win, draw, loss, or specific scoreline using a statistical distribution. This is the mathematical core that turns “Team A is stronger” into “62% chance Team A wins.”
Updating Predictions Before Kickoff
A prediction generated three days out and one generated 30 minutes before kickoff shouldn’t look identical. As lineups are confirmed, injuries are reported, and odds move in the market, a well-built model updates its output rather than freezing it the moment it’s first calculated. A prediction that never changes as new information arrives is usually a sign the system isn’t actually incorporating it.
Main Data Sources
The quality of any prediction is really a reflection of the data behind it – more relevant inputs generally mean a more reliable output.
Match Results
The most basic input: wins, draws, losses, and the score. Simple on its own, but it’s the foundation everything else builds on.
Goals For and Against
How many goals a team scores and concedes says more than the result alone – a team that wins 1-0 every week looks very different to a model than one that wins 4-3, even with identical points in the standings.
Home and Away Performance
Very few teams perform identically home and away. Splitting the data this way lets a model account for home advantage properly instead of averaging it away and losing the signal.
xG and Advanced Stats
Expected goals (xG) estimates the quality of chances a team creates and allows, not just how many shots were taken. A team that scores three goals from three shots got lucky; a team that creates a dozen good chances and scores once was probably unlucky. xG is more informative than raw shot counts because it separates the quality of an attack from the finishing on a given day, which tends to even out less than people expect.
League and Team Context
The same stat line means different things in different leagues – a 1.4 average goals game in a low-scoring league is not equivalent to the same number in a high-scoring one. Good models adjust for league-wide scoring trends and the overall context a team is playing in, rather than treating every league as interchangeable.
What The Model Can Predict
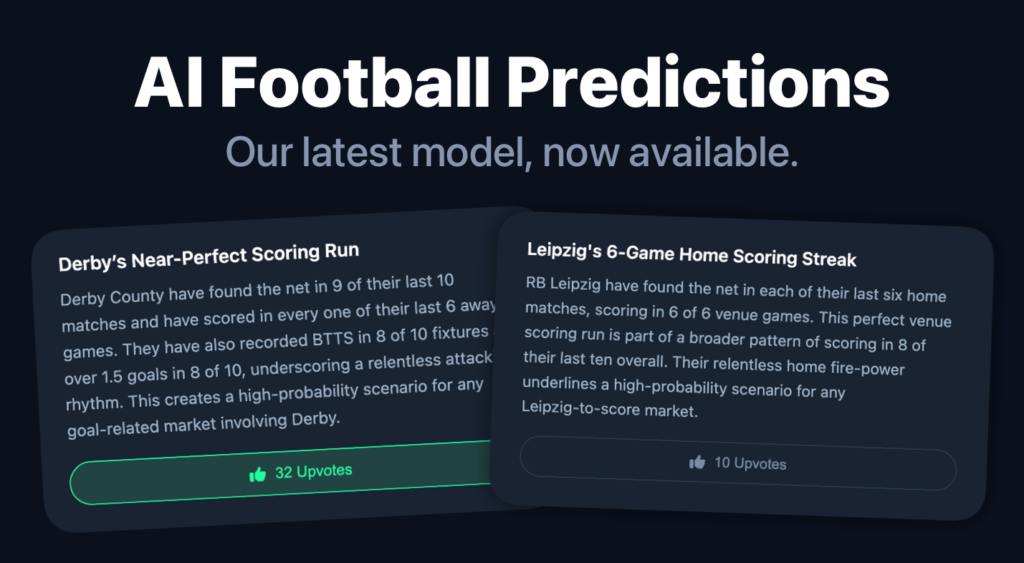
Once the underlying probabilities are built, they can be applied to a range of specific betting markets – not just who wins.
Match Winner
The most basic output: the probability of a home win, draw, or away win (often called 1X2). This is usually the first number a model produces, since everything else is often derived from the same underlying goal expectations.
Over/Under Goals
Rather than picking a winner, this estimates the probability that total goals in the match will go over or under a set line, most commonly 2.5. It’s built from the same goal-expectation numbers used for the match winner market, just applied differently.
Both Teams To Score
This estimates the likelihood that both sides find the net at least once, which depends more on the weaker team’s attack and the stronger team’s defensive solidity than the overall win probability does.
Correct Score
The most granular and least reliable output – the exact final score. Because there are dozens of plausible scorelines even for a lopsided match, no single one usually carries a high probability on its own; this market is more about seeing the shape of likely outcomes than expecting precision.
Probability and Edge
Beyond individual markets, the more useful output is often the model’s own confidence – how strongly it favors one outcome over another – and how that compares to what a bookmaker is offering. That comparison is where “edge” comes from, and it’s covered in more detail further down.
Limits And Risks
No model, however well-built, is working with complete information. Knowing where the gaps are matters as much as understanding what the model does well.
Injuries and Lineup Changes
A model trained on historical data doesn’t automatically know that a team’s top scorer is out injured unless that information is fed in separately and recently. Late lineup news is one of the biggest reasons a prediction made days in advance can age poorly.
Red Cards and Match Events
In-match events – a red card in the 20th minute, an early injury substitution – can flip a match’s likely outcome entirely, and pre-match models have no way to anticipate them. This is exactly why in-play predictions exist as a separate category, updating as the match itself unfolds.
Small Sample Problems
Football has relatively few matches per season compared to sports like basketball or baseball, which means models can be misled by a small run of unusual results – a team that wins three matches on penalty-box luck can look stronger than it really is until more data evens things out.
Why No Model Is Perfect
Football has a lot of variance built in – a single moment of brilliance, a refereeing decision, a deflected shot, can decide a match that the underlying run of play didn’t suggest should go that way. A model can estimate probability well and still be “wrong” on any single game, because that’s what probability means: it describes the whole distribution of outcomes, not any one match with certainty.
How To Read AI Predictions
Knowing how the model works is only half the picture – using the output well means understanding what the numbers actually mean.
Probability, Not Certainty
A 70% win probability means the model expects that outcome roughly seven times out of ten under similar conditions – not that it’s a sure thing. The other three times out of ten aren’t a bug in the system; they’re the whole point of expressing it as a probability rather than a pick.
Fair Odds
Converting a model’s probability into “fair odds” tells you what the odds should be if the model is right and there’s no bookmaker margin built in. Comparing that fair-odds number to what’s actually being offered is the first real check on whether a prediction is worth paying attention to.
Value Bets
A “value bet” isn’t the outcome the model thinks is most likely – it’s the outcome where the odds on offer are better than the model’s fair odds suggest they should be. A 30% chance can still be a value bet if the market is only pricing it at 15%; a heavy favorite can be a bad bet if the market has already priced it correctly or overpriced it further.
When To Ignore A Prediction
If team news breaks after the prediction was generated, if the model is working from a small or unusual sample, or if the output simply doesn’t line up with what you know about the match, that’s a reasonable time to set the prediction aside rather than defer to it automatically. A model is an input to a decision, not a replacement for one.
Best Practices For Users
Using these tools well is less about finding the “best” model and more about how you apply what it gives you.
Compare With Market Odds
Treat the model’s output as one side of a comparison, not a final answer. If it consistently lines up with or beats the market, that’s meaningful; if it never does, that tells you something too.
Check Team News
Confirm lineups, injuries, and suspensions close to kickoff rather than relying on a prediction generated well in advance. This single habit closes most of the gap between a stale prediction and a current one.
Track Long-Term Results
A handful of correct or incorrect predictions doesn’t tell you much about a model’s actual quality – variance in football is high enough that short runs are close to meaningless. Judge a system over dozens or hundreds of predictions, not five.
Avoid Blind Trust
No source – human or algorithmic – should be followed without some independent judgment. The value of an AI prediction is in the probability and the reasoning behind it, not in outsourcing the decision entirely.
What Makes AI Predictions Useful
They’re consistent, they update with new data, and they express uncertainty honestly through probability rather than false confidence. That combination is hard for a person to replicate match after match, especially across a full season rather than a handful of games.